Title: Mastering Trend Line Strategies: A Comprehensive Guide for Traders
Introduction: Trend Line
Trend lines are an important tool in technical analysis, giving traders information about market trends and potential entry or exit points. We will study the art of trend line strategies in this blog. The blog will provide traders with a comprehensive guide to harnessing the power of trend lines in a more informative and successful manner.
Understanding trend lines:
 Defining trend lines:
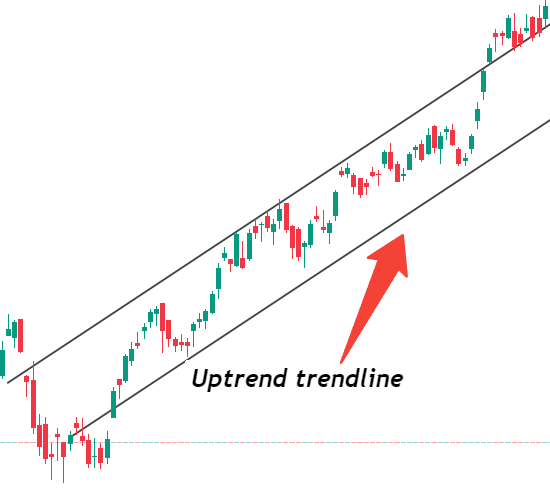
A graphical depiction of price trends on a chart is a trend line, which connects consecutive lows in an uptrend or highs in a downtrend.
Most of the time, an uptrend gets an ascending trend line, while a downtrend gets a descending trend line.
Drawing trend lines:
Identify at least two important support candles and draw a line connecting them. A line taken on a support candle indicates an uptrend, and a line taken on at least two significant resistance candles indicates a downtrend. Here, the special candle made on support and resistance is very important.
Second. Types of trend lines:
Support and resistance lines:
Support Line: Offers a steady hold at extended lower levels, indicating a strong psychological desire to purchase.
Resistance line: Crossing a series of highs in a row signals a point at which selling pressure is building and provides a psychological cue to sell.
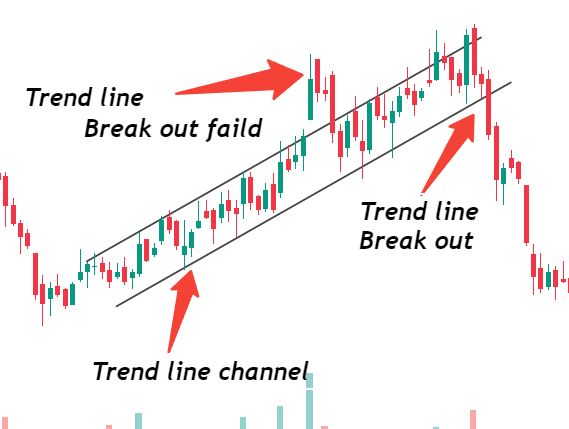 Channel Lines:
Uniform Channel: Parallel lines are drawn above and below an ascending trend line to contain price movements into a channel.
Unbiased Channel: The ascender is formed in a downtrend, but like a channel.
Third. Trend Line Trading Strategies:
Trend reversal confirmation:
Breakout Confirmation: When prices cross a trend line, a trend reversal appears, confirming a change in market sentiment.
Trend Continuation:
Bounce to support or resistance: When prices bounce off the trend line, it gives rise to new trades.
Outside the trend line: The long-term trend line provides a potential entry or exit point in a crossover.
pattern recognition:
Triangle System: Ascending and descending triangles are often formed between trend lines, showing potential breakout or breakdown points.
IV. Tips for Effective Trend Line Trading:
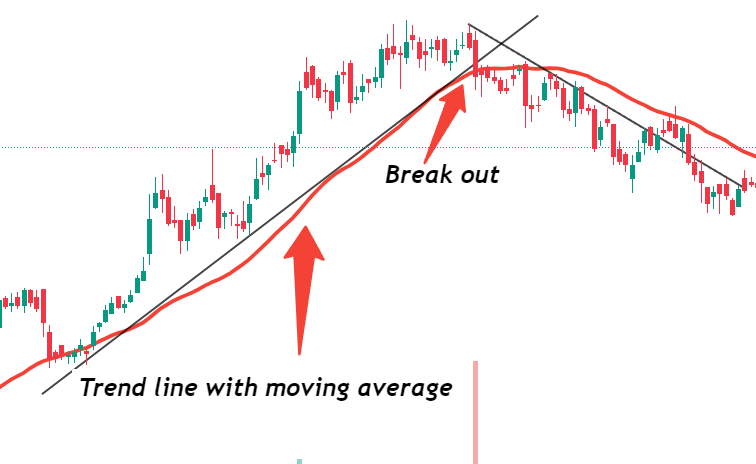 Confirm with other indicators:
Combine trend lines with other technical indicators, like moving averages or oscillators, for extremely strong signals.
Multiple Time Frame Analysis:
Confirm trend line signals by checking different time frames to see if the trend is stable.
Compatibility:
Adjust trend lines as new price data arrives, so they accurately reflect market dynamics.
conclusion:
Understanding trend line strategies is important for traders looking to make accurate decisions in the rapidly changing world of financial markets. Traders can enhance their ability to recognize trend reversals, continuations, and potential breakout opportunities, ultimately increasing their chances of success in the ever-evolving field of trading. This ability can come from understanding the types of trend lines, drawing techniques, and implementing effective trading strategies.
Disclaimer
Buying or selling financial instruments carries a significant degree of risk, and stockmarketup.in. makes no recommendations regarding this matter. Our readers and customers are free to choose to work with a registered investment advisor or to make their own trading and investment decisions, even though we provide instructional information on how to use our advanced stockmarketup.in trading tools. This article only represents the author’s opinions; stockmarketup.in or any of its affiliates do not endorse any viewpoints expressed here.I am not a SEBI-registered advisor or a financial adviser.
learn price action and technical knowledge courses
Related
Good information