Title: Mastering the Stock Market: A Comprehensive Guide to RSI Trading Strategies
Introduction:
Stock markets are very technical, so investors and traders look for good strategies to minimize both profits and risks. The Relative Strength Index (RSI) is a tool that is popular for its ability to identify potential trend reversals and overbought or oversold situations. In this blog, we will discuss the ins and outs of RSI and give some practical ways to increase your stock market success.
Understanding RSI:
The Relative Strength Index is an up-and-down wave motion that measures the speed of change in a stock’s price. J. Developed by Wells Wilder, the RSI is typically calculated over a 14-day period and expressed on a scale of 0 to 100. The basic purpose of RSI is to find overbought or oversold conditions, giving traders insight into potential trend reversals.
Major Level:
Before creating a strategy, it is important to understand the important levels on the RSI scale:
Overhead (70+): This signals that the stock may be overvalued and a pullback or reversal may occur.
Oversold (30): This suggests that a stock may be undervalued, and a rebound or uptrend is on the horizon.
Strategies to use RSI in the stock market:
Classic Deviation:
Look for examples where a stock’s price makes a new high but the RSI fails to surpass its previous high (bearish divergence) or where the RSI fails to fall below its previous low (bullish divergence).
Divergences can signal trend reversal, providing an important entry or exit point.
Overbought/Oversold Situations:
Use RSI that are overbought (RSI over 70) or oversold (RSI under 30).
When the RSI is overbought and oversold, consider buying and selling, hoping for a correction in either direction.
Trend and RSI confirmation:
Confirm the strength of the current trend by assessing RISI levels. In an uptrend, the RSI remains above 50, while in a downtrend, the RSI remains below 50.
Use RSI along with other technical indicators to determine the general trend before making trading decisions.
RSI and Support/Resistance:
Find important support and resistance levels on the price chart.
Look for RSI levels that match these support and resistance areas, as they can give additional confirmation of a potential trend reversal.
Linking RSI with Moving Averages:
Use RSI with moving averages to pick signals and reduce false positives.
Consider buying when the price is above the 200-day moving average and the RSI is above 50, and consider selling when the RSI is below 50 and the price is below the 200-day moving average.
conclusion:
Incorporating the RSI into your stock market strategy can provide important information about trend reversals, overbought and oversold situations, and the overall strength of the trend. It is important to remember that no signal guarantees success. Traders should use RSI in conjunction with risk management strategies and other technical analysis tools to make informed decisions in the dynamic world of the stock market. By mastering RSI trading strategies, you can increase your ability to deal with the complexities of the market and achieve more consistent and profitable results.
Disclaimer Buying or selling financial instruments carries a significant degree of risk, and stockmarketup.in. makes no recommendations regarding this matter. Our readers and customers are free to choose to work with a registered investment advisor or to make their own trading and investment decisions, even though we provide instructional information on how to use our advanced stockmarketup.in trading tools. This article only represents the author’s opinions; stockmarketup.in or any of its affiliates do not endorse any viewpoints expressed here.I am not a SEBI-registered advisor or a financial adviser.
learn price action and technical knowledge courses
 Understanding RSI:
 Major Level:
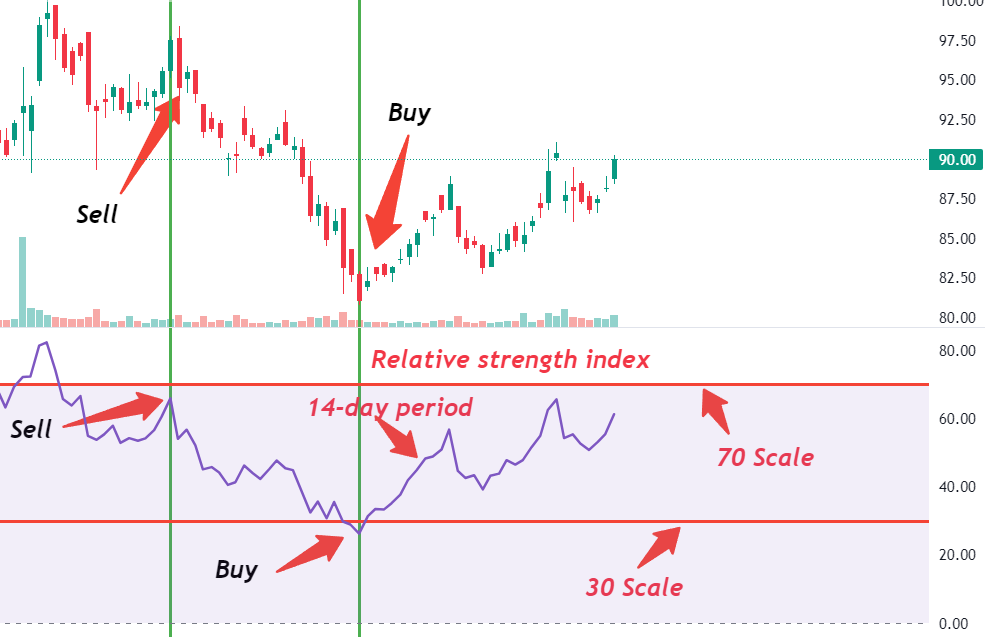 Overbought/Oversold Situations:
 Linking RSI with Moving Averages: