 What is a candlestick?
A candlestick chart is a tool to easily understand the share price of any company. Candlestick charts are one of the most popular tools in technical analysis to help traders quickly interpret price information. The price of the stock on the candlestick chart clearly indicates the mood of investors, and technical analysts use this information to time entry and exit points. trades. Candlestick charting is based on a method developed in Japan in the 1700s for visualizing the price of rice. Candlesticks are a great way to trade liquid financial assets like stocks, forex, and futures.
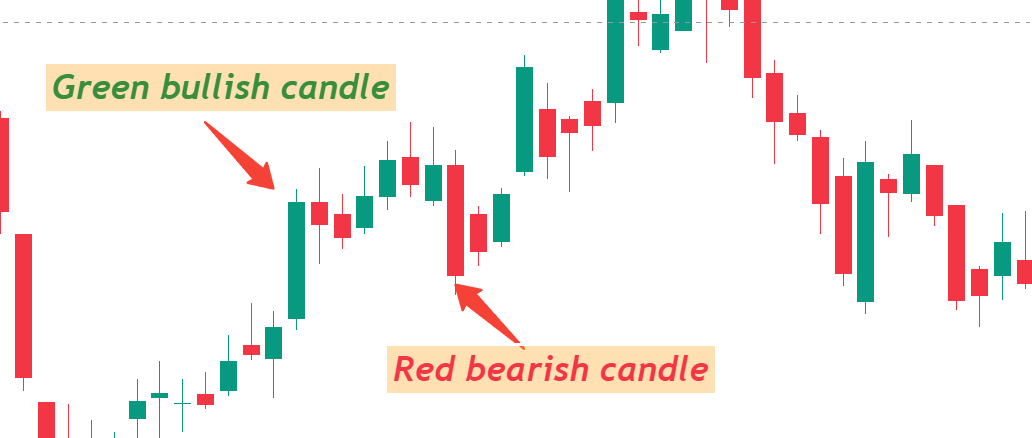
This article focuses on a daily chart, with each candlestick showing each day’s trading. It has three basic characteristics:
The body in a candle, where it opens, is called open; where it closes, is called close; the tail formed in the ups and downs of the candle is called high and low; the green color of the candle indicates the direction of bullishness; and the red color of the candle indicates bearishness.
Long white or green candlesticks indicate that there is a lot of buying pressure. This often signals an uptrend in price. But they should not be seen individually, but from the perspective of market structure. For example, a long white candle is likely to be more significant when there is support. Long black or red candlesticks indicate heavy selling pressure. This means that prices are bearish.
Candlestick trading patterns for two days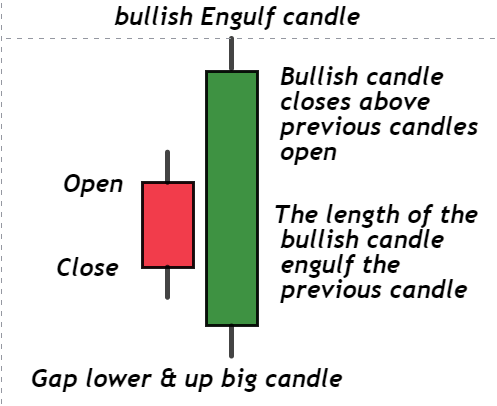
Many small trading strategies are created from candlestick patterns. The attached pattern signals a possible reversal trend: the first candlestick has a small body completely engulfed by the second candlestick. The bullish engulfing pattern appears at the end of a downtrend, while the bearish engulfing pattern appears at the end of an uptrend. Harami is a reversal pattern where the second candlestick is completely engulfed by the first candlestick and is opposite in color. In a related pattern, the doji is another candlestick in the Harami cross. When the candle’s close and open are equal
Candlestick trading patterns for three days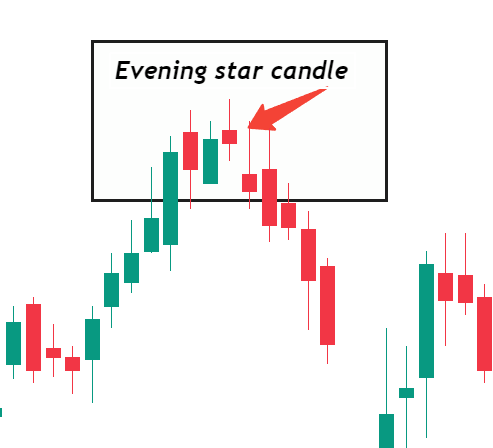
When the market is in an uptrend and a second day gapup candle is formed and there is a 3rd day bearish candle that covers the previous 3rd day, then from there the market goes bearish, and it is called the Evening Star Pattern. On the contrary, when the market is bearish, a gapdown candle is formed, and on the 3rd day, a gap-up candle is formed, which covers the 3rd day candle, and then a morning star pattern is formed from there. Long green candlesticks show strong selling pressure.
The longer the red candlestick, the more it shows that the sellers have pushed the price down significantly since the beginning. The long red candlestick, after a long period of progress, may show a turning point or resistance level in the future. A long red candlestick may indicate nervousness or capitulation.
marubozu candle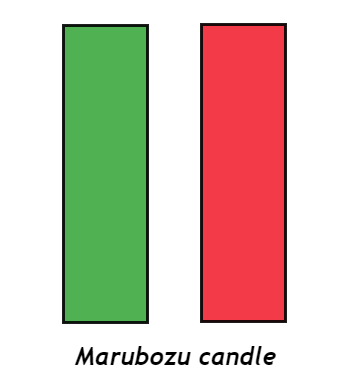
Red and green marubozu are the best long-size candlesticks. Marubozu does not have an upper or lower shadow; instead, the high and low are shown as open or closed. Green marubozu is formed when the open is low and the close is high. This means that buyers controlled the price action from the first trade to the last trade. Black marubozu is formed when the open is high and the close is low. This indicates that sellers held power over the price action from the first trade to the last trade.
Doji candle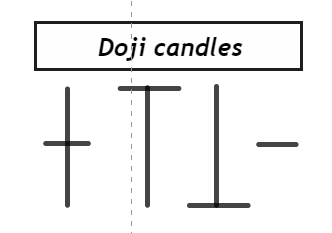
Doji is an important candlestick that provides information and components for many important patterns. When the open and close of a candle’s price are almost the same, a Doji is formed. The upper and lower shadows have different lengths. Dojis are neutral patterns. Future confirmation and past price action do not imply any bullish or bearish bias. The word “doji” covers both singular and plural. Okay, but open and closed are not necessarily equal. It is more important to capture the essence of the candlestick than the closed and open doji. Doji expresses a sense of tug of war or indecision between sellers and buyers. Prices keep moving above and below the opening level during the session but remain locked at or near the opening level. This results in stagnation. Neither the bearish nor the bullish lost control, and a major reversal could develop. The strength of the doji is determined by different securities. A stock of Rs.200 can make a difference of 1/8 point between the open and close. The strength of the doji will depend on the price, past volatility, and candlesticks. The body of the doji should be small, like a thin line, different from the previous candlesticks. But a doji that forms between the candlesticks with long, real bodies would be significant.
doji and trend
The relevance of a doji depends on the preceding candlesticks or trend. After a long white candlestick (doji), buying pressure is beginning to subside. A doji after a decline or a long black candlestick indicates that selling pressure is beginning to subside. Dojis indicate that the forces of supply and demand are more evenly matched and that after a long or advanced green candlestick in the trend, a Doji is formed, indicating that there is less buying pressure.
Disclaimer
Buying or selling financial instruments carries a significant degree of risk, and stockmarketup.in. makes no recommendations regarding this matter. Our readers and customers are free to choose to work with a registered investment advisor or to make their own trading and investment decisions, even though we provide instructional information on how to use our advanced stockmarketup.in trading tools. This article only represents the author’s opinions; stockmarketup.in or any of its affiliates do not endorse any viewpoints expressed here.I am not a SEBI-registered advisor or a financial adviser